LANOT Projects
Sargasso Monitoring


ASSOCIATED INSTITUTIONS
- National Laboratory for Earth Observation, Geography Institute, UNAM.
- Institute of Marine and Limnological Sciences, UNAM.
- Institute of Atmospheric Sciences and Climate Change, UNAM.
- Oceanus International.
Responsibles
- Dr. Manuel Suárez Lastra, Technical Director of LANOT. Email: lanot@geografia.unam.mx
- Dr. Jorge Prado Molina, Coordinator of LANOT. Phone: 56224358 Ext:45475
Phone: Tel. 56230222 Ext. 44877
Email: jprado@geografia.unam.mx
Collaborators
- Eng. Uriel de Jesús Mendoza Castillo
- M.Sc. Gabriela Gómez Rodríguez
- M.Sc. Francisco Javier Osorno Covarrubias
- M.Sc. in Geog. Víctor Manuel Jiménez Escudero
- Dr. Raúl Aguirre Gómez
- Dr. Steven Czitrom
- M.Sc. Iván Penié Rodríguez
- M.Sc. José Antonio Quintero Pérez
- Geog. Itzel Millán Ortega
- Geog. Guadalupe Tapia Varela
- M.Sc. in Geog. Ilma Maclovia Huy Domínguez
Fellows
- Eng. Intern Jesús Hernández Torres
Background
 Sargassum is a pelagic algae originating from the Sargasso Sea in the Atlantic Ocean. It usually floats in the ocean, acting as an ecosystem itself, providing shelter to crustaceans, turtles, and small fish, among other animals. The two main species of sargassum reaching Mexican coasts are Sargassum natans and Sargassum fluitants, sometimes mixed with seagrass when they wash ashore.
Since 2011, massive arrivals of this algae have caused severe environmental and economic problems in the Mexican Caribbean.
At the National Laboratory for Earth Observation, a satellite image-based algorithm was developed to monitor its annual landings, contributing to solving a national problem.
Objective
To monitor sargassum in the Mexican Caribbean area, providing resources such as vector files of its position in the sea and RGB composites for better analysis.Summary
An algorithm was developed to detect sargassum in the maritime zone near the coasts of Quintana Roo, extending to Belize, Guatemala, and part of Honduras, covering an approximate area of 150,000 km2. Images from Sentinel-2 satellites, part of the COPERNICUS constellation of the European Space Agency, are used. A mosaic of 18 satellite images is generated every 5 days. To identify sargassum, processes such as atmospheric correction, cloud masks, land and beach masks are applied, using bands 8, 8A, B4, and B11.
https://sentinels.copernicus.eu/web/sentinel/missions/sentinel-2
To bridge the five-day gap between Sentinel-2 image availability and provide an estimate of the movement of the centroids identified in the sargassum detection process, ocean current data provided by HYCOM (HYbrid Coordinate Ocean Model) is used.
Https://hycom.org
A model predicting sargassum movement was developed using these data, considering only surface currents. Additionally, the wind vector component is added via the GFS (Global Forecast System) model.
https://www.ncei.noaa.gov/products/weather-climate-models/global-forecast
This information is validated with fieldwork using drifting buoys fixed to sargassum rafts. These buoys collect and store speed and position data during their journey and are eventually retrieved onshore.
Besides sargassum dynamics, an animation quantifying the number of sargassum landings on beaches within the 5-day period mentioned above was created. To display and analyze the information, a web viewer integrating various data layers was developed. It allows users to quantify the sargassum area within the study zone. Users can also analyze time series using the same Sentinel-2 images available in our databases, which date back to late 2015 when this resource became operational. Additionally, other algorithms based on satellite sensors like MODIS, VIIRS, and ABI are under development. These will cover the time gap between Sentinel-2 overpasses, encompassing broader areas, reaching South America and much of the Atlantic.
It is important to note that this algorithm cannot detect sargassum beneath clouds or their shadows, so the presence of clouds underestimates the sargassum amount.

Documents
- Technical Sheet:“Sargassum does not turn into sand”
Sargassum Monitoring
Viewer
It includes various tools, notably: calculating the sargassum area in a user-selected region, statistics from the last 10 processed mosaics, and the attribute table of all detected sargassum polygons.


Sargassum Monitoring
Images
Latest Views
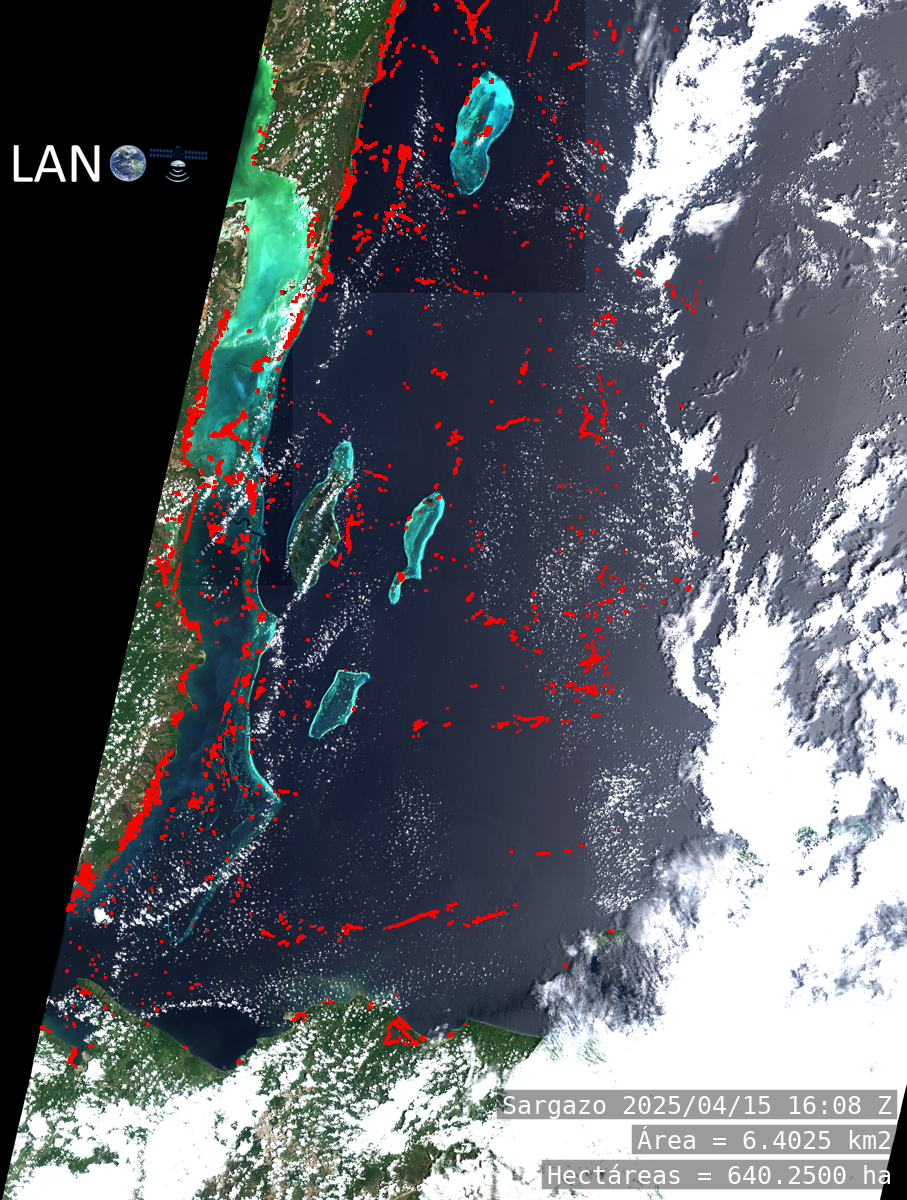
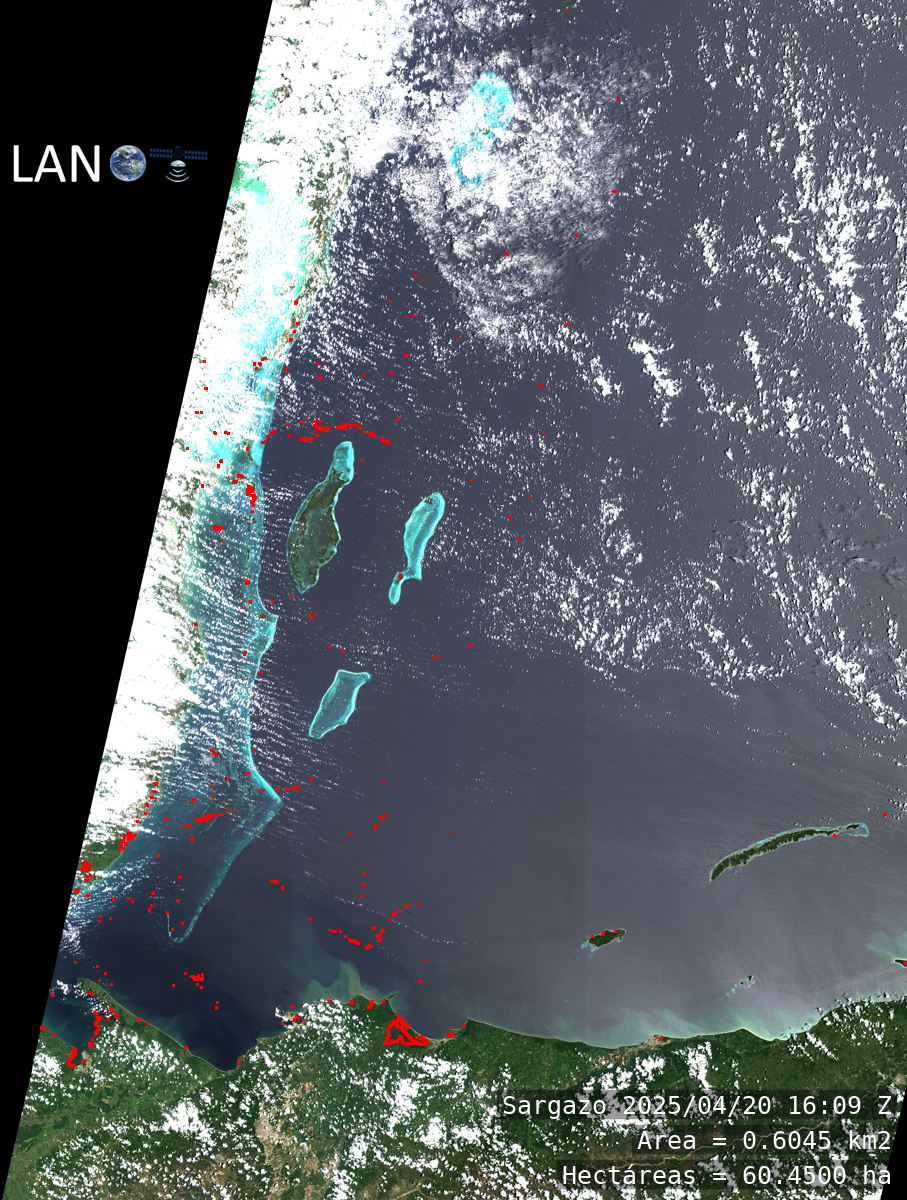
True color RGB composites along with sargassum polygons from the monitoring region in the Mexican Caribbean. The total sargassum area recorded is displayed in square kilometers.These views are updated every 5 days, depending on the overpasses of Sentinel-2A or Sentinel-2B satellites.

Sargassum Monitoring
Forecast